This is the first time I’m doing this, but since I like to try new things, here it is. I might sound like a broken record, but this year I got super crazy about Twin Peaks, and I can only viz about the things that interest me. So here it is: I’m gonna count all the damn fine coffees that were drunk in all 3 series. It’s 50+ hours of content, so my mind might just go to the Black Lodge by the time I finish. But there are not that many Twin Peaks data sets lurking around to be downloaded from the internet. I don’t have a single clue how the end result would look like, so as Coop says to Harry in the 7th episode of season 1:
Every day, once a day, give yourself a present. Don’t plan it. Don’t wait for it. Just let it happen. It could be a new shirt at the men’s store, a catnap in your office chair, or two cups of good, hot black coffee.

This will be a huge (say it out loud in David Lynch’s voice) surprise for me too, and I’m gonna document not just the progress I’ve made, but the dead-end streets as well.
May 4, 08:43
I started the coffee countdown 2 days ago, on Sunday, and I have to admit I’m going faster than I’ve estimated. I started watching the episodes on 4x speed, but I soon realized this will not work. I had to push the rewind button way too often. A couple of hours in, I could tell which scenes might include coffee spotting, and I changed my method to pushing the forward button instead of speeding up. I’m still bad at not being able to resist the temptation to rewatch my favorite parts, but by the end of the weekend, 12 episodes were down. I continued counting on Monday before work, lunch break, and after-hours, so I’m finished with the original seasons (S01-S02) and ready for The Return.

Observations
I counted 100+ coffees so far, and almost half of them were consumed by Harry and Coop. The biggest shock for me was that even though Norma owns and works at the RR, she never had a coffee in any scenes. Place-wise, the Twin Peaks Police Station seems to be a slightly more popular option than the RR itself. That might be a clue that the investigation is really running on coffee – as told in the 4.5 hours explained video.
May 4, 15:27
I started to have doubts about my data collection methodology. In most cases, I track the whole scene as a coffee event, but sometimes it’s just when someone has a cup in their hands. For example, if a group is hanging out at the diner eating, talking, AND drinking coffee, I log the event from the start of the scene to the end. But when the sheriff is sipping coffee from a takeaway cup in the police car before arresting someone, I only count those seconds when he held the mug – and not the arrest itself. Am I making a mistake here? I guess it’s all up to how I want to track it, and I might not even use the event log, but it started to bother the hell out of me.
By the way, I just found a youtube video of all coffee and pie mentions in the first two seasons.
May 4, 22:09
I’m super tired but started gathering the data from the third season (one episode down) that takes place approximately 25 years later and has a completely different vibe. Much slower, tons of new characters, and places to follow. Some I don’t even know the name of, so I need to track the cast on IMDB. I expect more coffee spottings in this season and that my progress will slow down significantly.
May 5, 09:09
I kicked my day off with 26 coffees +1 I actually drank. I have a new record for coffee spottings: 17 cups were consumed in S03E05, and Norma had her first black joe at the RR. What a morning!
Here are some ideas that popped into my mind but I haven’t fallen in love with:
Drawing a map of Twin Peaks to visualize the coffee distribution
Problem: Season 3 mainly takes place outside of Twin Peaks
Using pics for the heaviest coffee consumers
Something circular
Problem: not sure though that I want to use anything “complex” since I’d like my viz to be easily understandable
Taking the RR menu as an inspiration
Problem: not my style


Map source: Amazon, RR source: Pinterest
I started collecting a David Lynch inspiration board on Pinterest a couple of weeks back, but no breakthrough here either.
May 5, 21:22
The data is far from being ready, but I had a first peek at it in Tableau, and I’m not hating it! I like this Gantt chart view, but I’m not someone who makes things 2x, so I need to figure out how to spice it up – if I’m settling for this idea. Even the red-blue color palette seems like a good idea. Red and grey can represent the colors of Twin Peaks, the Black Lodge, evil… while blue can be a good choice for law enforcement.

Even though I’m still not sold on any ideas, the list of things I don’t want is rapidly growing.
Dark-theme: I’m not in the mood for dark vizzes lately
Long-form: I tried it out for the first time in my last viz, but it was not me. If I’d known where to cut the data, I’d never made it that long. On the other hand, I’ll spend so much time collecting this data that I don’t want to waste the effort on one chart. If I have to choose between long-form and sacrificing the content, I might do a series instead.
Complex charts
The thing that bothers me the most is interactivity. This data set would make a good use case for changing charts/dimensions on the dashboard, but then I would lose custom design elements. And every time someone asks me about this, I tell that I’m the person who’s willing to sacrifice readability for the sake of design in my pet projects. If custom fonts were available on Tableau Public, I wouldn’t hesitate for a minute. How nice would it be to change the coloring of the chart above from person to place?

May 6, 09:13
This is another idea that will most probably end up in the bin. I don’t hate it, but I don’t love it either. It’s a lousy cut-out from an official photo of Kyle MacLachlan that I made in 56 seconds in Photoshop, so it looks as bad as it should. I’m happy I didn’t spend 30 minutes making proper masking for a png file I won’t even use.

Btw, the inspiration came from this infographic by Chit Chart on Béhance:

May 7, 08:57
I could squeeze 2 episodes in before work: the coffee count is at 273 this morning. I’m optimistic that I can finish the dataset over the weekend, even though I have some more fun things to do. We’re baking a poppyseed – cherry pie on Saturday, hopefully as good as Norma’s.
May 7, 16:27
I started sketching during a meeting today. I felt a bit torn because I want to visualize the main characters and places together but not by doing it via interaction design. This might lead to my first experiment with secondary colors as patterns. The colors would stand for the people drinking the coffees, while the patterns would show the most significant places. This is what I put together in my workbook. I lost my corrector somewhere in the apartment, so I had to use double-sided tape to hide the mistakes. Sometimes it sucks to have OCD.

Since I wanted to have a better glimpse at the idea, I made a high(er) fidelity prototype in Procreate, and tbh I like it a lot.

May 8, 10:05
Data collection is ready! I saw people drinking 258 coffees in Twin Peaks. I can’t wait to start the visualization part, but I need to do a quality check first. That’s the part I hate the most. Checking if I spelled everything right, and if the comments make sense. And no matter how many times I’m going through it, mistakes will always remain.
May 8, 12:04
Stats for lunch! Kyle MacLachlan drank 50 coffees in Twin Peaks: 42 as Agent Cooper, 7 as Dougie, and only 1 as the Doppelganger. That adds up to 1 hour 48 minutes of him drinking coffee on screen (total playtime is 41 hours 18 minutes). I hope Dougie’s coffees stayed warm because even though he only had 7 cups, it took more than 27 minutes for him to finish them. No surprises here location-wise, Lucy might make the best coffee in Twin Peaks, as 20 out of 50 (40%) Cooper drank at the station.
May 12, 08:54
A couple of days passed since I had an update, but I have a couple of reasons for that. Number 1: I came to a block, and I have no ideas on how to progress. Unfortunately, I have more data points than what could fit into a single-page visualization. And I want to stay as far away as long-form vizzes as I possibly can. Number 2: I had tons of fun things to do rather than letting the lack of inspiration eating me up. We baked a poppyseed – cherry pie on Saturday, which I consider a semi-success: it tasted good but didn’t stick together. It was 28 degrees outside, so I spent a lot of time out biking or reading in the sun. And I discovered audiobooks! By adding a fake US address to my account, I managed to hack Kindle Unlimited, so I started listening to books while doing choirs and monkey work. I also finished the Foundation and My Year of Rest and Relaxation over the weekend.


May 12, 22:29
I’m dead tired, but this is how it usually goes. When the idea strikes, I sit for 6 hours in front of the computer without having a glass of water, and I can’t go to sleep before I finish. Today it was a custom font I fell in love with, and for the first time, I bought one. I decided I can’t live without owning Ogenblik Italic. What a beauty!

I decided to use the same colors as for my David Lynch viz to make it look consistent. But the major breakthrough was changing the secondary labels from lines to bubbles. I tried out the lines as planned, but they looked so horrible that I cried blood just by glancing at the monitor.
I’m sure there are some typos I missed and based on historical data, I will republish the viz tomorrow at least a hundred times, but I feel ready to show it. Check out the final version on Tableau Public.

May 13, 09:02
I uploaded the dataset to data.world if anyone wants to play around with it.
May 13, 23:47
I’m always anxious to post anything on reddit, but I felt confident adding this one to the Twin Peaks subreddit. I didn’t know I can get this much love on a platform famous for critique and hatred. Some of the comments that made my heart melt:
You’re a pretty crazy dude. have an upvote
I never knew I needed this in my life. Damn fine work.
Damn fine spare time usage.
Y’know, this is – excuse me – a DAMN fine post. I’ve seen I can’t tell you how many posts in my life and this, this is one of the best.
This took some dedication, man.

May 14, 12:59
I could never imagine having any of my works on the walls up to this point, but someone asked me yesterday whether I’m selling prints. I’m not, but this might change soon. I converted the image to a square-sized printable format and ordered the trial prints in two sizes: 30x30mm and 50x50mm. We’ll see how they turn out, and I’m a bit worried about high shipping costs. However, I made some mock-ups, and I’m in love.

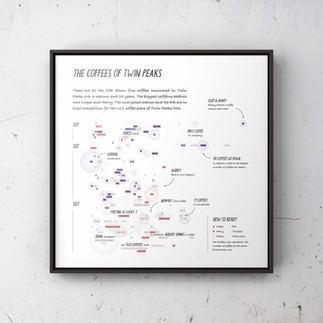


Mock-ups made in Voum
May 16, 10:33
Classic Judit. I had to cancel my print order after I realized I left some typos and misplacements in. Luckily the printing company was very supportive, and over the weekend, I managed to open my Etsy store.


Mock-ups by Prodigi
Comments